

This article was originally published by our good friend and colleague Thomas Thaler and shows the potential for increased online traffic and hotel bookings through Facebook performance marketing. It gives a fantastic insight how everything works together, the challenges, the advantages and most of all the success.
It is targeted mainly towards industry insiders and contains a lot of technical information and data. Nevertheless we believe it can be valuable knowledge for anybody with interest in the current performance marketing landscape. Without further ado, here we go.
—————————————————–
Author: Thomas Thaler, February 22, 2022
“The Corona pandemic was and still is no bed of roses for tourism. “
In the tourism year 2021, there was a decline of 41.5 million overnight stays throughout Austria, which corresponds to a minus of a astonishing 36.6%. It looks even more dramatic if you only look at the results of the 2020/21 winter season: Most accommodations were officially closed from November to April, resulting in a drop in overnight stays of almost 91% during this period compared to the previous year (and even that was already affected by a lock-down).
Bus tours, tour operators and booking portals have indeed often left out during this crisis. As a tourist service provider in such a situation, you therefore have only 2 options: Gratefully accept the cornucopia of government subsidies, which were certainly more attractive in this industry than in many others, and/or don’t let them take the butter off your bread and continue to go full throttle in your own digital marketing.
Easier said than done. So today I’d like to describe to you in a bit more detail the campaign setup and results of a tourism sales campaign throughout 2021 in Mark Zuckerberg’s meta-universe (Facebook, Instagram, Messenger, Audience Network). Especially in such a challenging time, operational mistakes hurt especially and potential stumbling blocks are unfortunately aplenty. This time, we’ll take a medium-sized, upper-class wellness hotel with over 100 rooms in Tyrol, Austria as an example.
Which KPIs are important?
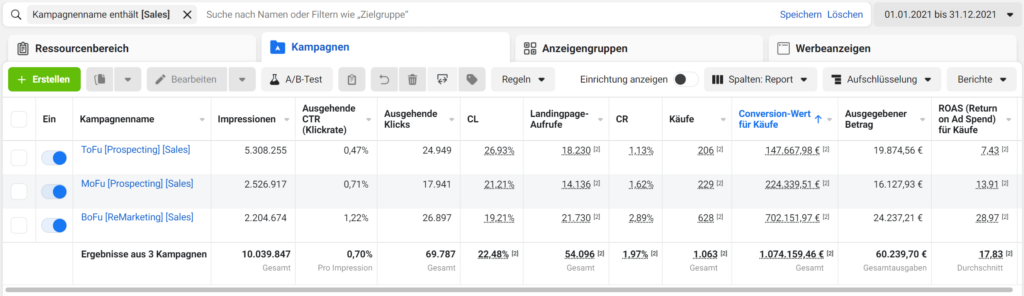
In an initial post view, 2021 looks pretty good. Why there is still no champagne for everyone follows a little further down.
But first, let’s take a look at what metrics we need for campaign management and evaluation, and why. The Facebook Ads Manager offers a number of more or less interesting metrics. Rule of thumb for selection: as little as possible but as much as necessary. By the way, the order doesn’t matter – mostly a halfway logical order in the buying process is mapped from left to right.
Impressions are all the visual contacts of our ads. Regardless of results, we always pay for these impressions – annoyingly at a cost price (CPM) that we don’t know before the campaign starts and that is subject to all kinds of influencing factors.
The CTR (also often called click-through rate = outgoing clicks / impressions) is a qualitative metric that gives us an insight into how well our creative (i.e. the ad) fits the selected target group. The higher this percentage, the better we have picked up the recipients of our advertising with images and text. Note: Increasing frequency usually leads to decreasing click-through rates.
From the outbound clicks we can see how often the advertisement was clicked. The landing page views (often called incoming clicks) then show us how many of them actually landed on our website. The differences are those users that we can’t/aren’t allowed to measure, so they remain quasi invisible to us. A certain part of them will still book with us – but we don’t see these results in the ad manager (see Attribution below).
A high CL (Consent-Loss = (outbound clicks – landing page views) / outbound clicks) is an indicator that either our obtaining the legally required DSGVO consent has some optimization potential or our website has technical problems. By the way, this little footnote [2] on some of the numbers in the Ads Manager tells us that. The CL is not available by default – the formula for it must be stored once as a so-called Custom Metric at Facebook.
The CR (conversion rate = purchases / landing page views) reflects the rate of completed bookings. It has a massive influence on profitability and is essentially dependent on the configuration of the web booking engine (WBE) in use and the target group sent to the website. The shorter and faster the path to booking completion, the higher the CR will tend to be. In our example, we basically eliminate the selection of extras/additional services, saving an entire step in the cycle. Also, starting with a booking period already specified eliminates another step. As a mnemonic, we can imagine a highway from Innsbruck to Salzburg with as few exits, exits, lane splits, detours and stop signs as possible.
Purchases is the absolute number of completed bookings that could be attributed to the campaign. Facebook uses a so-called attribution window here to decide whether a booking was triggered by an ad campaign at all. In our example, we use Facebook’s default setting, which attributes each conversion to the corresponding ad if it occurs 1 day after seeing it or 7 days after the ad was clicked. Shortening this window, while technically possible, makes little sense in our industry. For a wide variety of reasons, most people will probably allow longer than 24 hours to elapse between the first impulse and the actual booking completion.
The Conversion Value is the generated turnover in Euro of the above mentioned bookings. Attention: if local tax and sales tax are included in this, we have to consider this later in the ROAS. An Average Order Value (AOV) that is as high as possible favors profitability in purely mathematical terms – in our example, we are at just over €1,000 in sales per booking, which indicates a fundamentally high room rate and/or longer length of stay.
The Costs are then still the euros that we may transfer to Facebook as a thank you for the advertising campaign. These expenses are always already exclusive of the statutory VAT if the advertising account is configured correctly. They correlate (hopefully) exactly with the amounts of the payment method set.
The ROAS (Return on Ad Spend = conversion value / costs) is ultimately the most important metric: it shows us the profitability of our project, i.e. the ratio between sales and costs. A value of 1 means 100% in this context. Note: only the advertising expenses are taken into account here, not the marginal costs of our sold rooms, jump-fixed costs or any external fees that may be incurred. So while the break-even is mathematically 1, in reality it is more likely to be somewhere between 4 and 6. The higher the ROAS, the more likely we are to be in the black. It stands to reason that we always look first at the ROAS achieved for each individual ad during ongoing campaign optimization.
The selected Campaign Setup
Facebook itself always recommends Account Simplification – we therefore stick to this recommendation and set up only 3 campaigns, all of which run with the goal of conversion. Even though the learning phase cannot be completed positively for every ad group by far with this manageable budget, we consistently stick to the optimization event “purchase”.
We opt for a simple funnel structure with 3 clearly delineated stages. The first two are a kind of fuel for the third, they bring us the necessary traffic to the website. Then in the third one we earn the money with remarketing.
ToFu [Prospecting] [Sales]: top-of-the-funnel. Classic cold acquisition from users who have not yet interacted with our content and have not yet been to our website. One ad group with open targeting (broad) and one with interests. Limited to Austria due to pandemic. In the weeks where no travel warning is issued, Southern Germany and South Tyrol are added. Attention: Here we must not forget about the exclusion of the corresponding Custom Audiences.
MoFu [Prospecting] [Sales]: Middle-of-the-Funnel. Users who have interacted with us before, but have not yet visited our website. Within that, an ad group with interactors on Facebook and Insta, and one with video viewers. To increase the volume of the target groups, we add a 3% lookalike based on previous buyers. Even if that belongs more formally in ToFu.
BoFu [ReMarketing] [Sales]: Bottom-of-the-Funnel. At the bottom of the funnel we collect all website visitors of the last half year on a rolling basis, which is still almost half a million.
In each ad group, 3 different creatives run against each other. Normally, the Facebook algorithm decides quite reliably for the best performing variants. If this is not the case, we have to intervene manually. Attention: as soon as an ad is burned out (i.e. the results drop very fast), we have to replace the creative. In such cases, do not change the existing ad, but duplicate it and create a new ad. Otherwise, we will not be able to easily read the improvement or deterioration of our action afterwards.
For a rough estimate of the creative required, we need to take into account that we need each image or video used in at least 3 precisely specified formats: 16:9 landscape, 9:16 portrait and 4:5. This so-called asset customization for placements ensures that our creative looks good on every channel. For high-resolution photos, changing the format usually works quite well after the fact – for videos, this is difficult to do without sacrificing quality. Therefore, when recreating videos, we should pay attention to this right at the time of shooting.
In our example, the hotel runs a year-round operation. We therefore need (almost) everything coordinated with the 4 different seasons. After all, it makes little sense to advertise a mountain bike vacation with a snow picture.
In total, 84 advertisements ran over the year.
Have your own data under control
Any campaign optimization is only as good as the quantity and quality of the data analyzed (and the analytical skills of the person doing it). A little luck can’t hurt either.
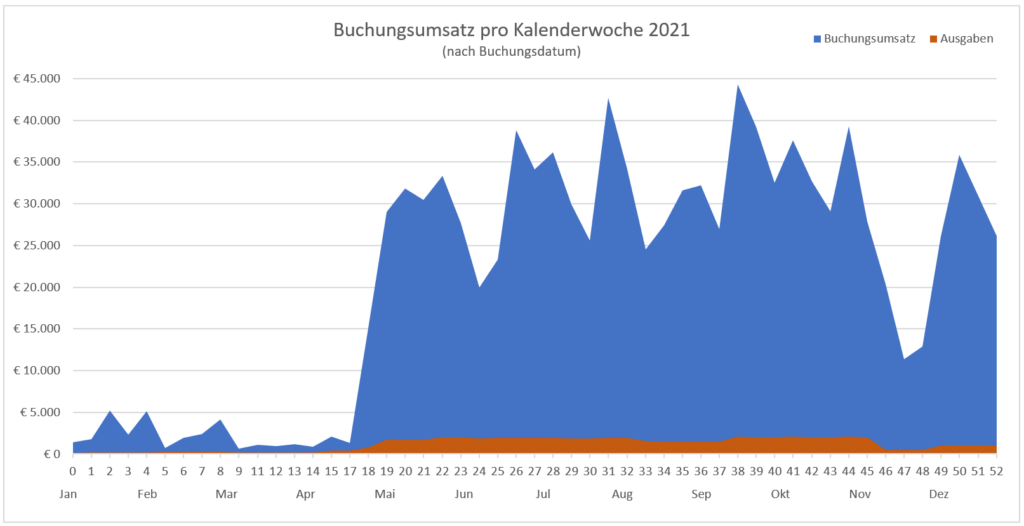
However, to keep the luck factor as low as possible, we now need to get even more granular. We’ve only talked about booking revenues so far – but there’s a subtle difference between agreed charges (which we know at the time of booking) and collected charges (which we don’t know until the day of departure at checkout).
Particularly in a year that was significantly marked by a pandemic, these two values often deviate quite significantly from each other. A booking made in August 2021 (when the Austrian chancellor officially declared the crisis over) for the beginning of December (when all hotels were officially closed) was usually not realized, but cancelled. The advertising costs already spent on this, however, remain.
In 2021, the official closures of all Tyrolean hotels (excluding professional stays) lasted from January 1 to May 28 and from November 22 to December 11.
Throughout the year, there were repeated official travel warnings from all source markets of Tyrolean tourism.
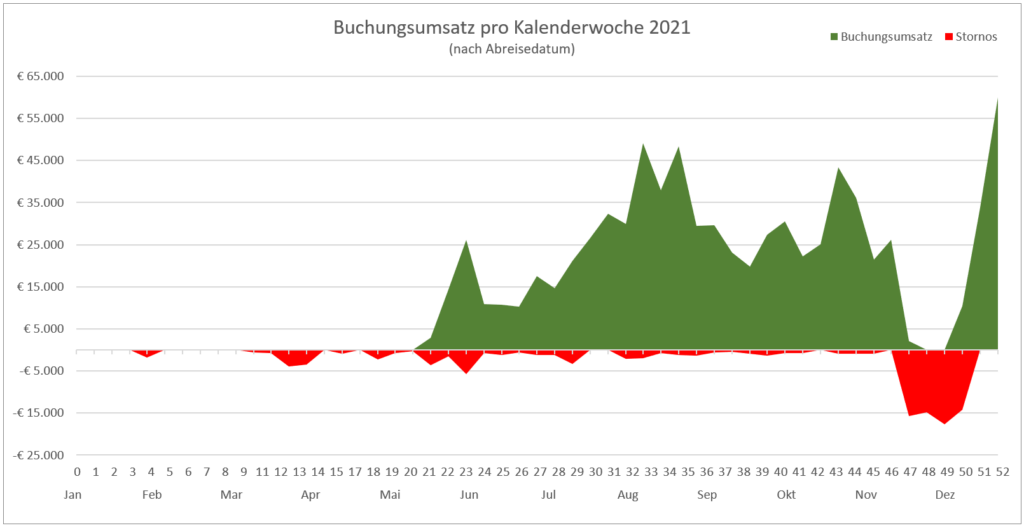
The cancellation rate is far above our usual average and is annoyingly dragging down our sales.
Of the originally reported 1,074,159.46 € booking revenue, only 793,961.46 € were actually realized, i.e. collected, in 2021. 111,118.20 € were cancelled and 169,079.80 € will (hopefully) be due in the next year 2022.
The ROAS of 17.83 reported in the advertising manager thus shrinks to 13.1. Still very satisfactory, but now much closer to reality.
Display conversion sales transparently
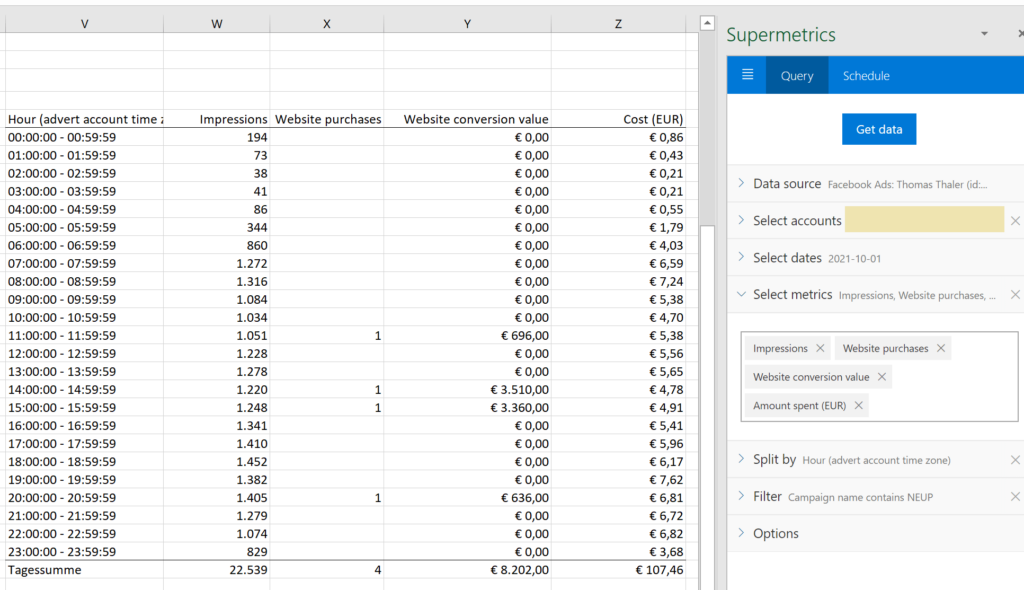
Unfortunately, to create a graph like the one above, the totals shown in the ad manager are not enough for us. We need to break down the generated sales down to each individual booking with all the details.
Our PMS (property management system) would of course have such details available at the push of a button – but only for all bookings made. But we only need this information for the bookings restricted according to the attribution window – only the bookings initiated by our campaigns are interesting at this point. Unfortunately, Facebook does not automatically support this request – so we have to resort to the proven tricks of professionals.
First, we implement a small program via Google Tagmanager that transfers all detailed data to a sheet after each completed booking. Most important is the unique booking number, date/time of the booking, amount and departure date. The remaining fields are optional depending on the desired evaluations.
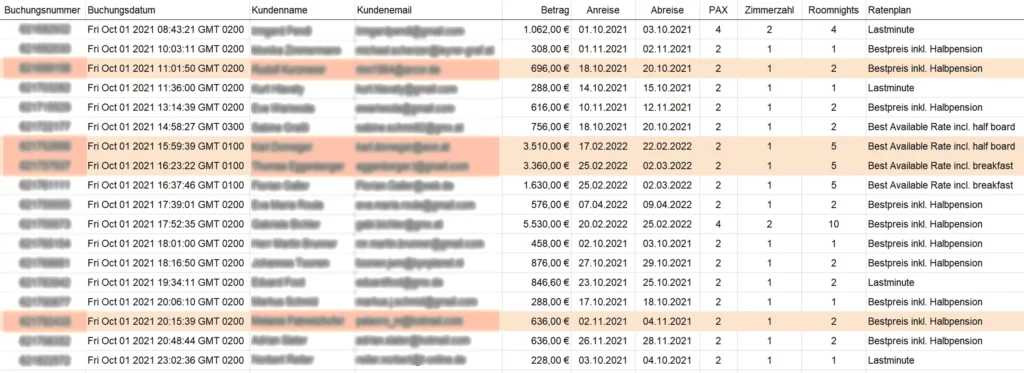
Once a day, we then use another small program to pull the broken down conversion sales from the Facebook API and assign them to the sheet according to time and amount and mark them in color. The sum of the marked amounts then corresponds to the sum shown in the ad manager.
Last but not least, at the beginning of each month we compare our sheet with the adjusted booking revenues of the previous month from our PMS. This way, we also see all cancellations and other deviating booking amounts. From the sheet we can then create any evaluation and statistics we are interested in.
Conclusion after 2 years of room sales in a pandemic
The period between booking and arrival is getting shorter and shorter. This offers opportunities to promote weather-dependent short-term offers for booking gaps.
Trying to generate concrete bookings in the middle of a lockdown with no end date is more than risky.
The risk must be taken away from the potential guest and therefore cancellation conditions must be adjusted. Even if it hurts every tourist’s soul: “Cancellable free of charge until the day of arrival”.
When working with special discounts or benefits, this should be technically solved right away via the URL. So the user does not need to enter anything extra.
If vouchers are sold, then rather as value vouchers, less as performance vouchers. This way we don’t block future dynamic price adjustments.
Facebook’s conversion tracking is more than patchy thanks to DSGVO and ATT. Without external tools to support it, nothing will work in the medium term.